Gantt Chart Project Management
The Gantt chart is a tool that presents the schedule of an entire project in visual terms.

Tell our team about your needs and we will customize the tool as part of your chosen package!
The Gantt chart is a tool that presents the schedule of an entire project in visual terms. It is an immensely effective tool for project management, as it shows the structure and project progress on a timeline. The Gantt chart benefit is a full and transparent schedule that helps manage work better, control the course of the project tasks and quickly introduce any amendments when necessary.
What is a Gantt Chart?
A Gantt chart is a type of bar chart that shows how a project is progressing over time. Gantt charts are widely used in project and task management to track the status of tasks and identify potential bottlenecks. Gantt charts can be created using spreadsheet software, such as Microsoft Excel, or specialized online Gantt chart software. When creating a Gantt chart, each task is represented by a bar, and the length of the bar indicates the duration of the task. Tasks are typically grouped by task type, and the Gantt chart can also show dependencies between tasks. Gantt charts software is a valuable tool for project managers, as they provide a clear overview of the project timeline and allow potential problems to be identified quickly.
Who is the Gantt chart named after
The Gantt chart history is colorful and is reflected in the name given to it by its inventor. An American, Henry Gantt is recognized as the visual project schedule's Gantt Chart creator. In 1910, Gantt developed this technique for a Bethlehem Steel facility and published it in Engineering Magazine. Following the history, Karol Adamiecki was the first visual project presentation pioneer, who developed the first tool of its kind back in 1896 but he published his research after Gantt in 1931.
Gantt Chart in Project Management
After its invention, the Gantt method has revolutionized project management and offered a much more transparent and visual approach to handling them so that they are completed on schedule.The Gantt chart was one of the solutions that were needed when projects grew more and more complicated and advanced. The Gantt chart software became one of these new solutions. Project managers and those who carried out tasks on projects fell in love with project visualization on a timeline.The chart was completed more than a century ago, and the entire process is still in its prime, and not one project manager could think of completing a difficult project without it.
What is the best way to make a Gantt chart?
We have several options in this area. To begin, let's look at the paper technique, which was the first method to use a timetable in business – and it predates the internet by centuries!Remember that the chart was not utilized to visualize technology in 1910 but as a new and innovative technique to depict the whole project. Actions completed in a project were previously recorded on pieces of paper, and the Gantt chart simply provided a different perspective on them.In this situation, a piece of paper with a variety of colors and a range of activities is more than enough to get started. This may be an excellent choice in some cases, such as the expected timetable. The most effective Gantt chart tools are dedicated applications that allow for more efficient project and task management. We utilize the existing technology that we currently have.
Excel Gantt chart template
There are many different ways to create a Gantt chart, but one of the most popular methods is to use an Excel template. Excel templates for Gantt charts are widely available online and can be easily customized to suit the specific needs of your project. Using an Excel template is a great way to get started with creating your Gantt chart, and can help to make the project planning process smoother and more efficient. If you're looking for a simple and effective way to create a Gantt chart, a Gantt chart in excel is a great option.Gantt charts are a popular project and task management tool and for good reason. They help to visualize the timeline of a project and can be used to track progress and identify potential bottlenecks. Excel is a versatile tool that can be used to create Gantt charts, and there are many simple Gantt chart templates available online.However, Gantt chart software can make the process even easier, by providing features such as automatic scheduling and the ability to share charts with team members. Whichever approach you choose, Gantt charts can be a valuable addition to your project management toolkit.
Gantt Charts In Google Sheets
Gantt charts are a valuable tool for project and task management, and with Google Sheets, they're free and easy to create. With a Gantt chart tool, you can track the start and end dates of your project, as well as milestones and tasks. To create a Gantt chart in Google Sheets, simply go to the File menu and select "Make a copy." Then, enter your project data into the template. You can add as much or as little detail as you like, but be sure to include the start and end dates for each task. Once you have your data entered, you can begin to format your Gantt chart. Change the color of the bars to represent different project phases of the project, or add numbers to show the percentage completed for each task. You can also add conditional formatting rules to highlight tasks that are due soon or overdue. With a Gantt chart in Google Sheets, you can easily keep track of your project's progress and ensure that it stays on schedule.
Project Management Gantt Charts
Project and task management Gantt charts are an essential tool for project managers. They help to visualize project timelines and track project progress. In a Gantt chart, each task is represented by bar charts. The length of the bar chart corresponds to the duration of the task. Tasks can be further divided into subtasks, and dependencies can be indicated by linking bars together. Modern Gantt charts are an essential project planning tool, and they can help project managers to avoid overlap and ensure that all tasks are completed on time. By visualizing project timelines, Gantt charts can also help project managers to identify potential bottlenecks and make adjustments to the project plan accordingly.
Gantt Chart in IC Project Management Software
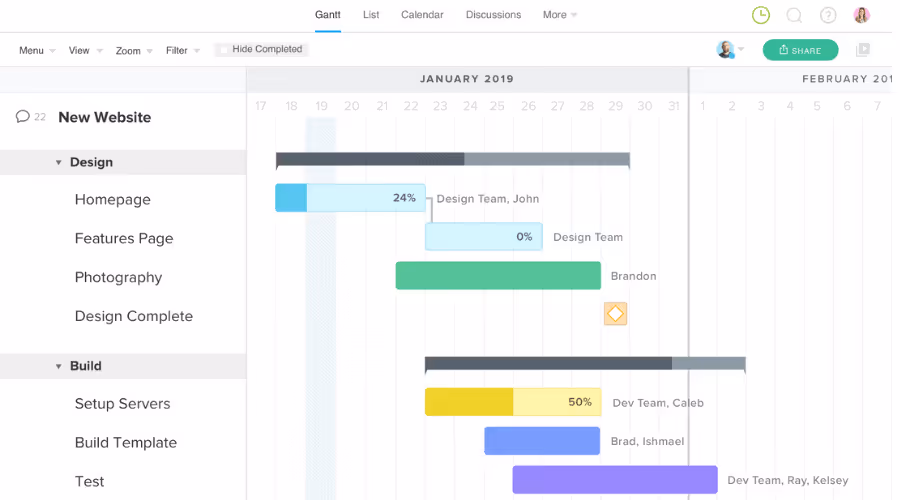
Let's have a look at IC Project, a Gantt chart software. A new project must be added to this program via its fundamental phases or single activities. We don't have to worry about the schedule development procedure itself. The program generates the Gantt chart automatically.When a project and timetable are already prepared in the IC Project, we may observe its structure (stages + activities or even tiny parts of the project) as well as a complete timeline on the right side.
What does a Gantt chart show?
The program color marks the structural parts of the project. For instance, a green horizontal bar chart is an entire project, blue bars are stages and grey blocks are task groups. All project-related processes are put on a timeline, which allows instantaneous control of whether the entire project is being done on time.It's worth noting that the timetable is flexible. What exactly does it imply? It's a huge benefit of technology: we may alter the deadlines on the Gantt chart ourselves. For example, if we want to set separate deadlines for phases, we can do so right now on the chart.If, however, there's a need for change, it can also be done on the chart and all changes will be updated for the entire project. It's a great asset as we can see what the timeline of the project is in real-time. As in many other aspects of our lives, technology is the key to success – also in the case of creating Gantt charts.
How to make a Gantt chart?
1. Add a project and set the deadline
If we use dedicated software, there are certain procedures to follow for a project to be added. Start from the project name, start date, and end dates for the Gantt chart to begin with.
2. Create a project structure
What is the definition of a project structure? It may be divided into single tasks, task groups, and even phases depending on the stage of development. The project manager retains the authority to decide whether they are stages or activities. Remember that those smaller components will be plotted on the Gantt chart.
3. Adapt the deadline for smaller tasks in a project
Start and finish dates are established for each project and every tiny task. This is precisely what all project- and task-based techniques recommend. You must modify deadlines to suit the sectors depending on how you break down your project. As a result, you'll get an in-depth representation of the overall project's timeline.
4. Set dependencies
What are dependencies, and how do they work? They're connections between actions in your project, as well as between tasks or stages.By using technological connections, you will automate the process where delaying one action will affect the rest of the deadlines in the project. If you make the actions dependent on each other properly, changing the deadline of one action will automatically change the other deadlines.This is a key function of the Gantt chart for every efficient project manager. Dependencies can indicate connections for informational purposes, but with a tool like IC Project, you will update the project's further course automatically.
5. Define milestones for your project
A milestone is an event with no duration which signals an important point in a project. It's usually an informational point which is a very important message for project leaders. A milestone has its specific time, it can represent a client's decision or a checkpoint.
6. Control the deadlines and make quick changes!
The Gantt chart is a tool that allows you to control all deadlines in a project in an effective way. If there is a need for change, you will make it in the chart. This makes things very much easier when managing complex projects in real-time.
In a nutshell, what are the advantages of a Gantt chart?
The Gantt chart is a very powerful project management tool. It's a must-have for project-based work. There are many methods to make project schedules, from the conventional, paper method to the most effective tools for project management.In IC Project Management Software, every project comes with an automatically created Gantt chart which will show a properly structured project in a different and transparent view. If you want to carry out a project schedule according to plan, the Gantt chart will be your best bet hands down.It will allow you to easily adapt to deadlines in the stage of your project, control the course of all work and quickly respond to any changes. Switch to the Gantt chart project management in ICP and get to know its possibilities.
Also read

Update 06.2026 – communication and finance at an even higher level
Discover the June IC Project update featuring a full messenger view, contextual message search, and full KSeF integration to improve communication, project management, and financial workflows.

Marketing Plan - Definition, Examples, and Applications
What is a marketing plan? Check out the definition, examples, and learn how to develop an effective marketing strategy step-by-step.
Update 05/2026: Greater project flexibility, more powerful automations and streamlined communication
What's New in IC Project – May 2026. Check out the new project types, advanced process automations, and the message pinning feature, all of which enhance project management efficiency.
Try IC Project in your company Our team is ready to help!

Create a free account and test with no obligation